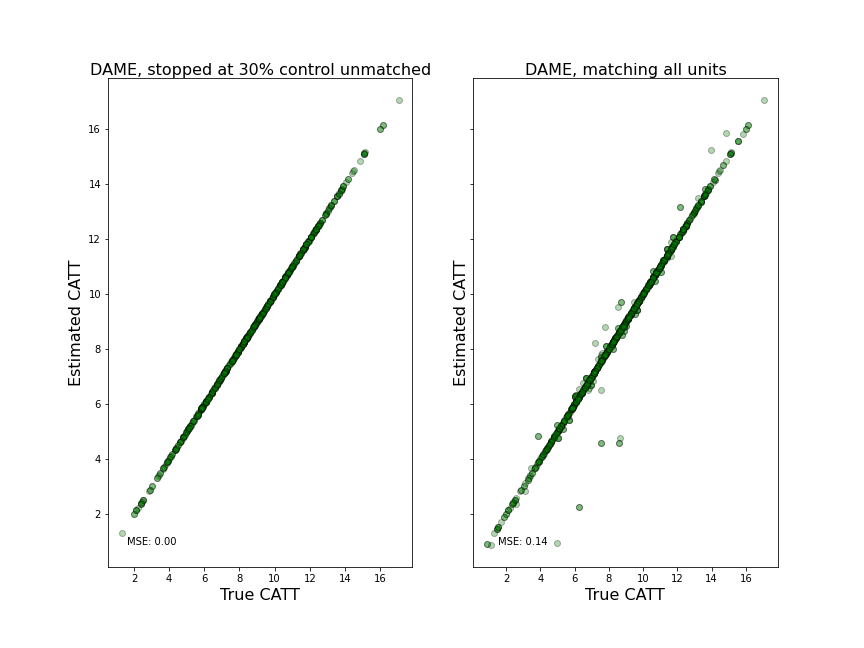
Early Stopping and Treatment Effect Estimates
Both the FLAME and DAME algorithms begin by matching any units that are exactly the same on all covariates in the dataset (“identical twins”). As iterations of the algorithm progress, later matched units are likely to have the highest error in estimated treatment effects. For this reason, there are situations where a user may wish to stop the FLAME or DAME algorithm in order to avoid poor quality matches, and if its not critical that all units are matched.
From this example, we see that if high accuraccy between the estimated treatment effect and true treatment effect is a priority, then this algorithm should be stopped early.
import numpy as np
import pandas as pd
import dame_flame
import matplotlib.pyplot as plt
from sklearn.metrics import mean_squared_error

df, true_catt = dame_flame.utils.data.generate_binomial_decay_importance(
    num_control=1000, num_treated=1000, num_cov=10, bernoulli_param=0.5, bi_mean=2, bi_stdev=1)

model = dame_flame.matching.DAME(repeats=False, verbose=0)
model.fit(holdout_data=df)
model.predict(df)

model_stop_early = dame_flame.matching.DAME(repeats=False, verbose=0, early_stop_un_c_frac=0.3)
model_stop_early.fit(holdout_data=df)
model_stop_early.predict(df)

estimated_catt_full = []
true_catt_full = []
estimated_catt_early = []
true_catt_early = []

for unit in range(len(df)):
    if df.loc[unit]['treated'] == 1:
        temp_cate = dame_flame.utils.post_processing.CATE(model, unit)
        if temp_cate is not np.nan:
            estimated_catt_full.append(temp_cate)
            true_catt_full.append(true_catt[unit])
        temp_cate = dame_flame.utils.post_processing.CATE(model_stop_early, unit)
        if temp_cate is not np.nan:
            estimated_catt_early.append(temp_cate)
            true_catt_early.append(true_catt[unit])

f, axes = plt.subplots(1, 2, gridspec_kw = {'width_ratios':[1, 1]}, figsize=(12,9), sharey=True)

def draw_scatter(ax, x, y, title, color, mse, yticks= False):
    ax.scatter(x, y, c = color, alpha = 0.3, marker = 'o', edgecolor = 'black')
    ax.set_title(title, pad = 0.2, wrap = True, fontsize=16)
    ax.tick_params()
    ax.set_ylabel("Estimated CATT", fontsize=16)
    ax.text(3, 1, "MSE: {:.2f}".format(mse), ha='center', va='center')
    ax.set_xlabel('True CATT', fontsize=16)


draw_scatter(axes[0], true_catt_early, estimated_catt_early, "DAME, stopped at 30% control unmatched",  "green",
             mean_squared_error(true_catt_early, estimated_catt_early), True)

draw_scatter(axes[1], true_catt_full, estimated_catt_full, "DAME, matching all units",  "green",
             mean_squared_error(true_catt_full, estimated_catt_full), True)
