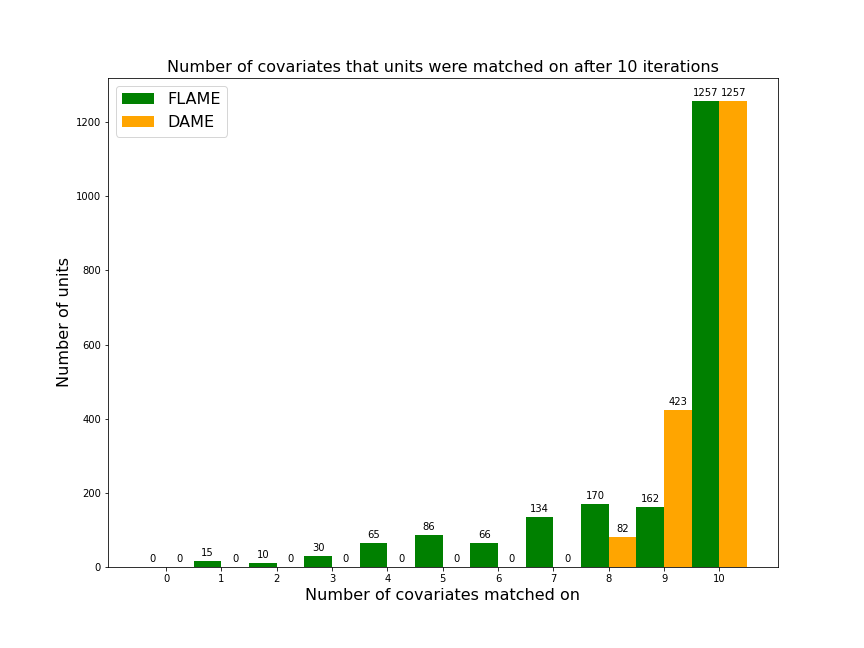
Comparing Match Quality of DAME and FLAME
Both the FLAME and DAME algorithms begin by matching any possible identical twins (“exact matches”) in the dataset, meaning any units that have the same values on every possible covariate.
As the FLAME algorithm progresses to match units that do not have identical twins, each subsequent iteration of the FLAME algorithm will attempt to match on one fewer covariate. So, suppose the total number of covariates in a dataset is $r$. After any units that can be exact matched on $r$ have been found, the next iteration of FLAME will attempt to match on $r-1$ covariates. In the next iteration, it improves upon the previous covariate set used for matching, and match on $r-2$ covariates.
However, DAME will consider any covariate set options that will yield the highest-quality matches. The size of covariates matched on does not necessarily need to decrease over iterations of the algorithm.
This one of the key advantages the DAME algorithm has over FLAME. DAME produces higher quality matches, meaning that more units are matched on a large number of covariates. We show this below using matplotlib [1], running the same dataset on FLAME and DAME for 10 iterations.
import numpy as np
import pandas as pd
import dame_flame
import matplotlib.pyplot as plt

# Generate Data
num_covariates = 10
df, true_catt = dame_flame.utils.data.generate_binomial_decay_importance(num_control=1000, num_treated=1000,
                    num_cov=num_covariates, bernoulli_param=0.5, bi_mean=2, bi_stdev=1)

# Get matches using DAME and FLAME
model_dame = dame_flame.matching.DAME(repeats=False, verbose=0, early_stop_iterations=10)
model_dame.fit(holdout_data=df)
result_dame = model_dame.predict(df)

model_flame = dame_flame.matching.FLAME(repeats=False, verbose=0, early_stop_iterations=10)
model_flame.fit(holdout_data=df)
result_flame = model_flame.predict(df)

# replace all the '*'s with NAs so we can get a count of the NAs.
result_flame = result_flame.replace(to_replace='*', value=np.nan)
result_dame = result_dame.replace(to_replace='*', value=np.nan)

# This will map: {number of covariates matched on : number of units matched on that number of covariates}
dict_matched_result_dame = {k:0 for k in range(0,num_covariates+1)}
dict_matched_result_flame = {k:0 for k in range(0,num_covariates+1)}

# iterate through the rows in the df and count the number of non-NaN values in the row to determine
# how many units that row was matched on.
for i in result_flame.count(axis=1):
    dict_matched_result_flame[i] += 1

for i in result_dame.count(axis=1):
    dict_matched_result_dame[i] += 1

x = np.arange(len(dict_matched_result_flame.keys()))  # the label locations
width = 0.5  # the width of the bars

# plot
f, ax = plt.subplots(figsize=(12,9))
rects1 = ax.bar(x - width/2,  dict_matched_result_flame.values(), width, color="green", label = "FLAME" ) #, stopping at {}% control units matched".format(percent), hatch="/")
rects2 = ax.bar(x + width/2, dict_matched_result_dame.values(), width, color = "orange", label = "DAME") #, stopping at {}% control units matched".format(percent), hatch = "\\")
ax.set_ylabel('Number of units', fontsize=16)
ax.set_xlabel('Number of covariates matched on', fontsize=16)
ax.set_title('Number of covariates that units were matched on after 10 iterations',
            fontsize=16)

ax.set_xticks(x)
ax.set_xticklabels(dict_matched_result_flame.keys())
ax.legend(fontsize=16)

def autolabel(rects):
    """Attach a text label above each bar in *rects*, displaying its height."""
    for rect in rects:
        height = rect.get_height()
        ax.annotate('{}'.format(height),
                    xy=(rect.get_x() + rect.get_width() / 2, height),
                    xytext=(0, 3),  # 3 points vertical offset
                    textcoords="offset points",
                    ha='center', va='bottom')


autolabel(rects1)
autolabel(rects2)

plt.savefig('flame_vs_dame_quality.png')
