Exact Matching
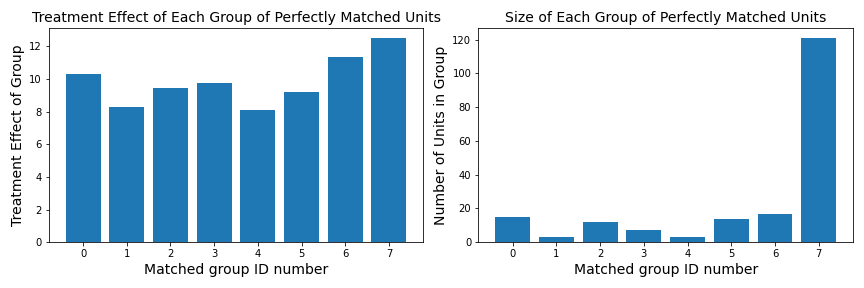
The DAME or FLAME algorithm can be configured to be used for exact matching, using the early stopping criteria parameter early_stop_iterations=1. We illustrate this below. On a dataset with 200 units and five covariates that was generated with little randomness in which most covariate values are the same, we are only interested in exactly matched units. The output generated by the verbose=3 parameter shows that the majority of units are matched after one iteration. We visualize the treatment effect of each group, or the CATE of each group, using matplotlib [1]. We also visualize the matched groups’ sizes, which shows that one group has the majority of units.
import dame_flame
import matplotlib.pyplot as plt


df,_ = dame_flame.utils.data.generate_binomial_decay_importance(num_control=100, num_treated=100,
                    num_cov=5, bernoulli_param=0.9, bi_mean=2, bi_stdev=1)

model = dame_flame.matching.FLAME(verbose=3, early_stop_iterations=1)
model.fit(holdout_data=df)
res = model.predict(df)

groups = list(range(len(model.units_per_group)))
cate_of_group = []
len_group = []
for group in model.units_per_group:
    cate_of_group.append(dame_flame.utils.post_processing.CATE(model, group[0]))
    len_group.append(len(group))


f, ax = plt.subplots(1, 2, gridspec_kw = {'width_ratios':[1, 1]}, figsize=(12,4))
ax[0].set_ylabel('Treatment Effect of Group', fontsize=14)
ax[0].set_xlabel('Matched group ID number', fontsize=14)
ax[0].set_title('Treatment Effect of Each Group of Perfectly Matched Units', fontsize=14)
ax[0].bar(groups,cate_of_group)

ax[1].set_ylabel('Number of Units in Group', fontsize=14)
ax[1].set_xlabel('Matched group ID number', fontsize=14)
ax[1].set_title('Size of Each Group of Perfectly Matched Units', fontsize=14)
ax[1].bar(groups,len_group)

plt.tight_layout()
plt.savefig('treatment_effect_size_of_groups.png')
